Note
Go to the end to download the full example code.
Simple logistic regression with RIM
RIM (regularised mutual information) is a proposal of model by Krause et al. (2010) which consists in maximising for a linear model under \(\ell_2\) penalty. In this example, we show how to do clustering of a Gaussian mixture using RIM.
import numpy as np
from matplotlib import pyplot as plt
from sklearn import datasets

from gemclus.linear import RIM
Load a simple synthetic dataset
# Generate samples on that are simple to separate
X, y = datasets.make_blobs(centers=3, cluster_std=0.5, n_samples=200, random_state=0)
Train the model
Create the RIM clustering model (just a logistic regression) and fit it to the data.
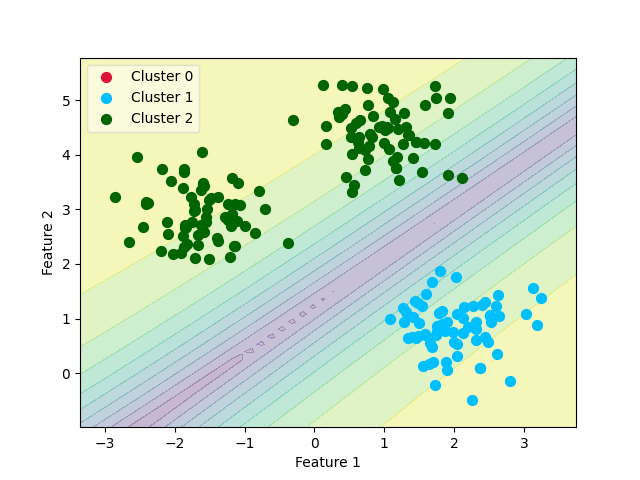
Final Clustering
Let us take a look at the decision boundaries according to the probabilities
# Predict a grad of inputs
x_vals = np.linspace(X[:, 0].min() - 0.5, X[:, 0].max() + 0.5, num=50)
y_vals = np.linspace(X[:, 1].min() - 0.5, X[:, 1].max() + 0.5, num=50)
xx, yy = np.meshgrid(x_vals, y_vals)
grid_inputs = np.c_[xx.ravel(), yy.ravel()]
grid_pred = clf.predict_proba(grid_inputs)

# Isolate probability of the argmax
zz = grid_pred.max(1)
zz = zz.reshape((50, 50))

plt.contourf(xx, yy, zz, alpha=0.3, levels=10)

# Now, show the cluster predictions
y_pred = clf.predict(X)
X_0 = X[y_pred == 0]
X_1 = X[y_pred == 1]
X_2 = X[y_pred == 2]

ax0 = plt.scatter(X_0[:, 0], X_0[:, 1], c='crimson', s=50)
ax1 = plt.scatter(X_1[:, 0], X_1[:, 1], c='deepskyblue', s=50)
ax2 = plt.scatter(X_2[:, 0], X_2[:, 1], c='darkgreen', s=50)

leg = plt.legend([ax0, ax1, ax2],
                 ['Cluster 0', 'Cluster 1', 'Cluster 2'],
                 loc='upper left', fancybox=True, scatterpoints=1)
leg.get_frame().set_alpha(0.5)

plt.xlabel('Feature 1')
plt.ylabel('Feature 2')

plt.show()

print(clf.score(X))
0.44865384782317197
Total running time of the script: (0 minutes 0.304 seconds)