Note
Go to the end to download the full example code.
An introducing example to clustering with an MLP and the MMD GEMINI
We show in this example how to use the gemclus.mlp.MLPMMD to fit a simple mixture of Gaussian distributions. The architecture here is a two-layer neural network trained with the MMD GEMINI, an objective equivalent to kernel KMeans.
from matplotlib import pyplot as plt
from sklearn import datasets

from gemclus.mlp import MLPMMD
Generate data
X, y = datasets.make_blobs(centers=3, cluster_std=0.5, n_samples=200, random_state=0)
Create the MLP clustering model and fit it
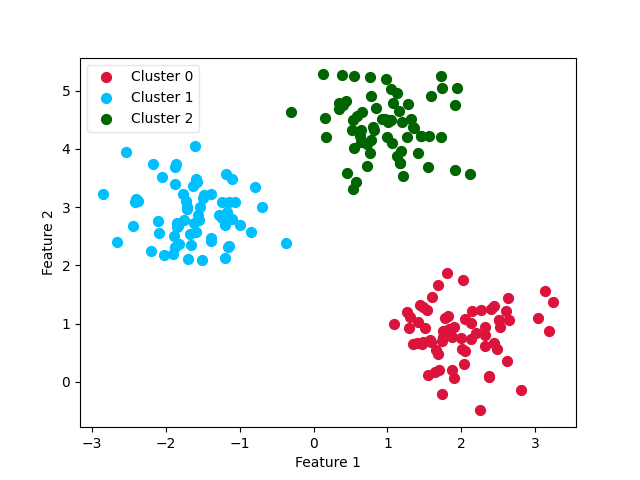
Plot the final clustering
y_pred = clf.predict(X)
X_0 = X[y_pred == 0]
X_1 = X[y_pred == 1]
X_2 = X[y_pred == 2]

ax0 = plt.scatter(X_0[:, 0], X_0[:, 1], c='crimson', s=50)
ax1 = plt.scatter(X_1[:, 0], X_1[:, 1], c='deepskyblue', s=50)
ax2 = plt.scatter(X_2[:, 0], X_2[:, 1], c='darkgreen', s=50)

leg = plt.legend([ax0, ax1, ax2],
                 ['Cluster 0', 'Cluster 1', 'Cluster 2'],
                 loc='upper left', fancybox=True, scatterpoints=1)
leg.get_frame().set_alpha(0.5)

plt.xlabel('Feature 1')
plt.ylabel('Feature 2')

plt.show()
Total running time of the script: (0 minutes 0.686 seconds)