Note
Go to the end to download the full example code.
Comparative clustering of circles dataset with kernel change
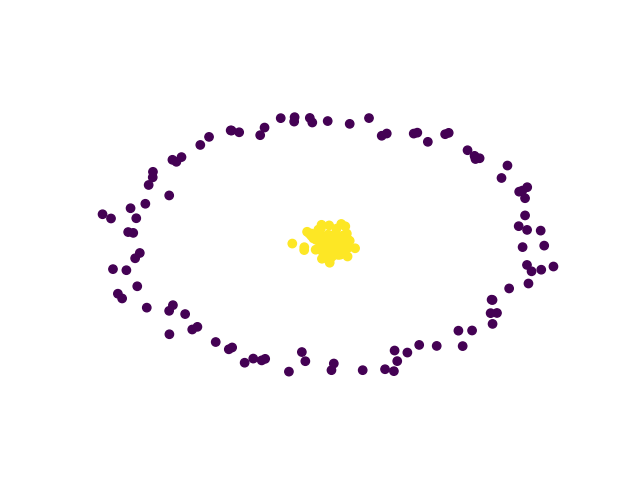
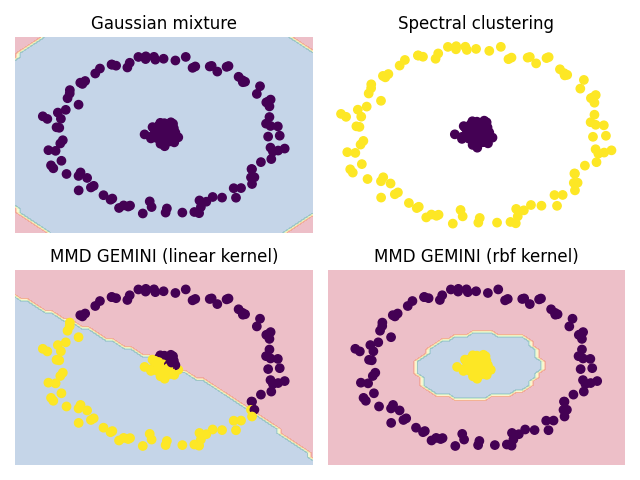
We show here a simple dataset consisting in two centred circle that can be challenging for some clustering algorithms. This dataset can be challenging for GEMINI as well, unless we change the kernel adequately.
import numpy as np
from matplotlib import pyplot as plt
from sklearn import datasets, metrics
from sklearn.cluster import SpectralClustering
from sklearn.mixture import GaussianMixture

from gemclus import mlp
Draw samples for the circle dataset
# We start by generating samples distributed on two circles
X, y = datasets.make_circles(n_samples=200, noise=0.05, factor=0.05, random_state=0)

# then normalise the data
X = (X - np.mean(X, 0)) / np.std(X, ddof=0)

# Have a look at it
plt.scatter(X[:, 0], X[:, 1], c=y)
plt.axis("off")
plt.ylim((-3, 3))
plt.ylim((-3, 3))
plt.show()

Training clustering models
# Gaussian mixture model
# We set the covariance type to *spherical* to lighten the number of parameters in correspondence
# to the symmetry of the data
# We ease the job by proposing a initialisation of the means close to the actual means
gm = GaussianMixture(n_components=2, covariance_type='spherical', means_init=np.zeros((2, 2)),
                     max_iter=1000, random_state=0).fit(X)

# Spectral clustering
sc = SpectralClustering(n_clusters=2, random_state=0).fit(X)

# MMD MLP with linear kernel
# We use multi layered perceptrons because a linear model is incapable of drawing the optimal decision boundary
euclidean_gemini = mlp.MLPMMD(n_clusters=2, random_state=0).fit(X)

# Then we take a similar model but use the RBF kernel for the computation of MMD
rbf_gemini = mlp.MLPMMD(n_clusters=2, kernel="rbf", random_state=0).fit(X)
Display predictions and decision boundaries
# We generate a grid of values for showing the decision boundary
x_vals = np.linspace(X[:, 0].min() - 0.5, X[:, 0].max() + 0.5, num=50)
y_vals = np.linspace(X[:, 1].min() - 0.5, X[:, 1].max() + 0.5, num=50)

xx, yy = np.meshgrid(x_vals, y_vals)
grid_inputs = np.c_[xx.ravel(), yy.ravel()]

# Plot for the Gaussian mixture
plt.subplot(2, 2, 1)
plt.contourf(xx, yy, gm.predict(grid_inputs).reshape((50, 50)),
             alpha=0.3, cmap=plt.cm.Spectral)
plt.scatter(X[:, 0], X[:, 1], c=gm.predict(X))
plt.axis("off")
plt.title("Gaussian mixture")

# Plot for the spectral clustering (cannot draw decision boundary)
plt.subplot(2, 2, 2)
plt.scatter(X[:, 0], X[:, 1], c=sc.labels_)
plt.axis("off")
plt.title("Spectral clustering")

# Plot for the MMD MLP GEMINI with linear kernel
plt.subplot(2, 2, 3)
plt.contourf(xx, yy, euclidean_gemini.predict(grid_inputs).reshape((50, 50)),
             alpha=0.3, cmap=plt.cm.Spectral)
plt.scatter(X[:, 0], X[:, 1], c=euclidean_gemini.predict(X))
plt.axis("off")
plt.title("MMD GEMINI (linear kernel)")

# Plot for the MMD MLP GEMINI with RBF kernel
plt.subplot(2, 2, 4)
plt.contourf(xx, yy, rbf_gemini.predict(grid_inputs).reshape((50, 50)),
             alpha=0.3, cmap=plt.cm.Spectral)
plt.scatter(X[:, 0], X[:, 1], c=rbf_gemini.predict(X))
plt.axis("off")
plt.title("MMD GEMINI (rbf kernel)")

plt.tight_layout()
plt.show()

Total running time of the script: (0 minutes 18.121 seconds)