Note
Go to the end to download the full example code
An introducing example to clustering with an MLP and the MMD GEMINI
An example plot of gemclus.base_gemini.DenseMMDOvO
from matplotlib import pyplot as plt
from sklearn import datasets

from gemclus.mlp import MLPMMD
Generate data
X, y = datasets.make_blobs(centers=3, cluster_std=0.5, n_samples=200, random_state=0)
Create the MLP clustering model and fit it
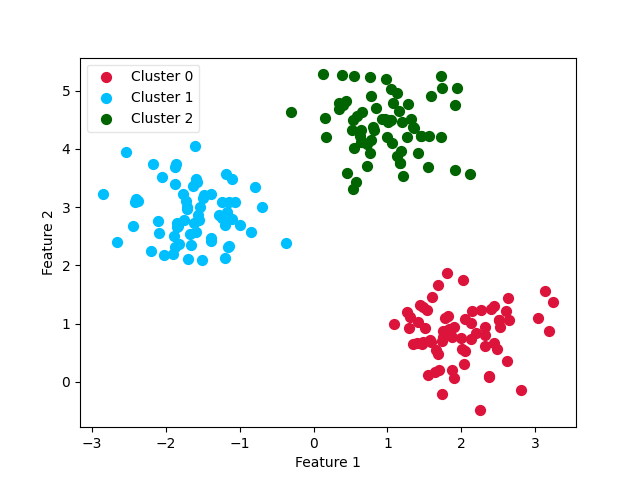
Plot the final clustering
y_pred = clf.predict(X)
X_0 = X[y_pred == 0]
X_1 = X[y_pred == 1]
X_2 = X[y_pred == 2]

ax0 = plt.scatter(X_0[:, 0], X_0[:, 1], c='crimson', s=50)
ax1 = plt.scatter(X_1[:, 0], X_1[:, 1], c='deepskyblue', s=50)
ax2 = plt.scatter(X_2[:, 0], X_2[:, 1], c='darkgreen', s=50)

leg = plt.legend([ax0, ax1, ax2],
                 ['Cluster 0', 'Cluster 1', 'Cluster 2'],
                 loc='upper left', fancybox=True, scatterpoints=1)
leg.get_frame().set_alpha(0.5)

plt.xlabel('Feature 1')
plt.ylabel('Feature 2')

plt.show()

Total running time of the script: (0 minutes 0.768 seconds)